Variance Analysis
Calculation of annualized standard deviation across equity and fixed-income ETFs to define the efficient frontier.
View Methodology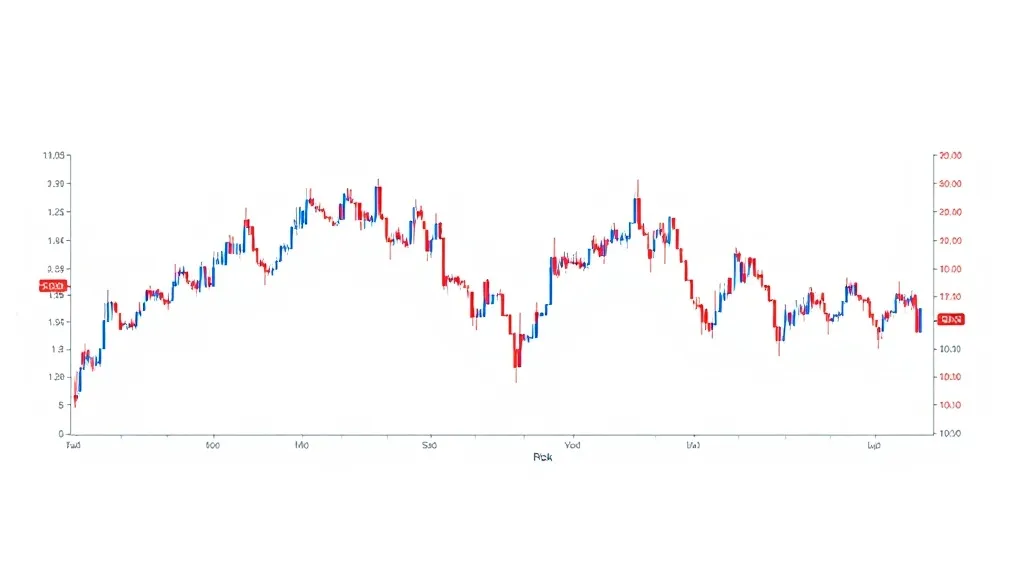
Technical breakdown of Modern Portfolio Theory (MPT) implementation in Canadian robo-advisory systems. We analyze how variance, standard deviation, and covariance matrices determine asset allocation for retail investors.
Calculation of annualized standard deviation across equity and fixed-income ETFs to define the efficient frontier.
View MethodologyAnalysis of threshold-based vs. time-based rebalancing triggers and their impact on tracking error and tax drag.
Compare PlatformsMonte Carlo simulations modeling 5,000+ market scenarios to estimate Maximum Drawdown (MDD) for various risk profiles.
Robo-Advising DataRobo-advisors in Canada utilize specific risk-scoring algorithms to categorize investors into portfolios ranging from 100% Fixed Income to 100% Equity. These algorithms analyze inputs from Know Your Client (KYC) questionnaires, focusing on time horizons and liquidity requirements. For instance, a 5-year horizon typically triggers a 40/60 equity-to-bond ratio to mitigate volatility.
The integration of Tax-Efficiency Metrics ensures that rebalancing events do not trigger excessive capital gains within non-registered accounts. Algorithms prioritize selling overweight positions in TFSAs or RRSPs first to maintain the target asset allocation without increasing the investor's tax liability.
Data from 2023 indicates that automated rebalancing reduced the average tracking error by 0.45% compared to manual portfolio management. This efficiency is achieved through drift-threshold triggers, usually set at 5% for major asset classes like the TSX 60 or S&P 500.
Once a week we send a digest of the best articles.
Compare how different Canadian robo-advisors handle volatility during periods of high market variance.