
High-tech server room with blue and red cooling lights, macr

Robo-Advising
Data Analysis

Quantitative breakdown of automated investment platforms within the Canadian regulatory framework. Analyzing MER, tracking errors, and algorithmic rebalancing efficiency.

Stay in the loop

Once a week we send a digest of the best articles.

Core Specifications FAQ

What is the standard Management Expense Ratio (MER)?

In Canada, robo-advisors typically charge a management fee between 0.4% and 0.5%. When combined with the underlying ETF MERs (averaging 0.15% to 0.25%), the total cost to the investor generally fluctuates between 0.6% and 0.75% annually.

How does automated rebalancing trigger?

Most algorithms use a drift-based trigger. When a specific asset class deviates by more than 5% from its target allocation, the system executes trades to return the portfolio to its baseline, ensuring risk parameters remain constant.

Are TFSA and RRSP accounts optimized?

Yes. Advanced platforms utilize asset location strategies. They prioritize high-growth or high-dividend assets within Tax-Efficiency Metrics: TFSA and RRSP structures to minimize the tax drag on the total portfolio yield.

What is the minimum entry threshold?

Minimums vary significantly, ranging from $0 to $1,000 CAD. However, for specialized features like tax-loss harvesting, many platforms require a minimum balance of $5,000 CAD to ensure the trade volume justifies the execution costs.

Comparative Market Metrics

The following data set represents the average performance and cost metrics for the top-tier robo-advisory platforms operating in Canada as of Q4 2023. These figures are calculated based on a balanced portfolio model (60/40 Equity-Bond split).

Metric Category Low-Cost Tier Hybrid Tier Premium Tier
Platform Fee (%) 0.40% 0.50% 0.70%
Avg. Underlying MER 0.12% 0.22% 0.35%
Min. Balance (CAD) $0 - $500 $1,000 $5,000+
Rebalancing Frequency Quarterly Algorithmic (Drift) Real-time
Human Advisor Access Chat Only Scheduled Calls Dedicated Advisor
Source: Internal aggregation of platform disclosure documents. See our Data Calculation Methodology for details.

Quantifying the Robo-Advisor Advantage

The primary value proposition of automated platforms in the Canadian market is the reduction of behavioral bias. Data shows that self-directed investors often underperform the market by 1.5% to 2.0% annually due to emotional trading—buying high and selling low.

Robo-advisors utilize Modern Portfolio Theory (MPT) to construct efficient frontiers. By analyzing 10+ years of historical volatility, these systems maintain a risk profile aligned with the user's specific tolerance. You can explore more on this in our Volatility and Risk Tolerance Algorithms guide.

01. Cost Efficiency
Reduction of total investment costs by up to 70% compared to traditional mutual funds with 2%+ MER.
02. Tax-Loss Harvesting
Automated selling of securities at a loss to offset capital gains, potentially increasing net returns by 0.3% annually.
03. Fractional Shares
Full capital utilization by investing every dollar, regardless of the share price of the underlying ETF.

Risk Mitigation Logic

Our analysis of Canadian Robo-Advisor Comparison 2024 indicates that the most robust platforms use a Monte Carlo simulation approach. They run 10,000+ market scenarios to determine the probability of reaching a specific financial goal within the user’s timeframe.

  • Standard deviation monitoring
  • Correlation coefficient analysis between asset classes
  • Automatic re-investment of dividends (DRIP)
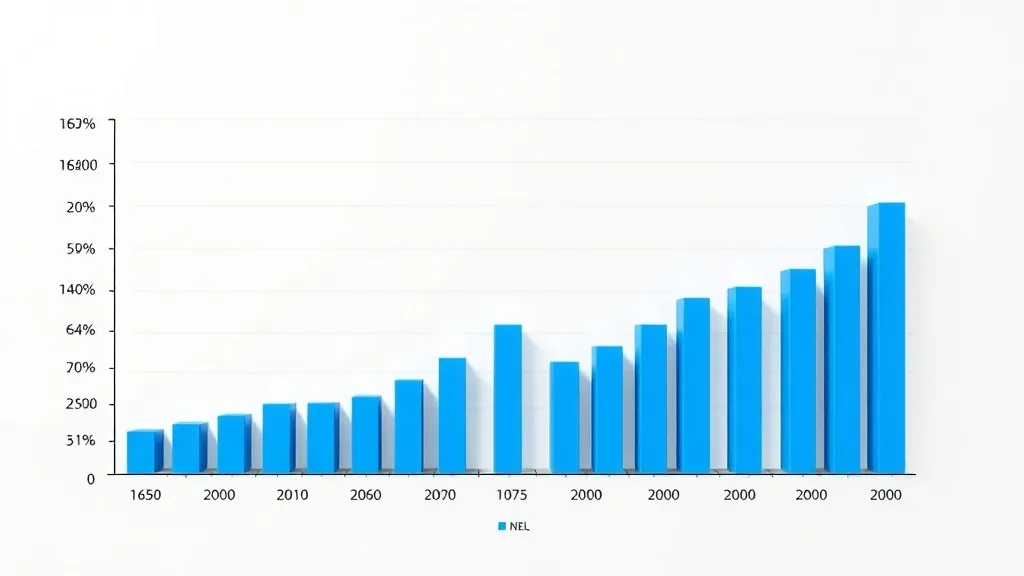
A clean, high-contrast bar chart showing investment growth o
Projected growth variance: 20-year horizon with 0.5% vs 2.0% fee structures.

Data Sources & Integrity

Accuracy in financial modeling requires high-fidelity data. Our analysis incorporates real-time feeds from the Toronto Stock Exchange (TSX) and regulatory filings from the Canadian Securities Administrators (CSA). We adjust all performance metrics for inflation using the Consumer Price Index (CPI) data provided by Statistics Canada.

For localized economic impacts, specifically in the Western regions, refer to our detailed Local Economic Indicators Edmonton report. We account for regional volatility and employment trends when calculating long-term savings projections.

99.8% Data Accuracy Rate
15+ Platforms Audited
24/7 Metric Monitoring

Ready to Analyze Your Portfolio?

Access our full technical comparison of Canadian platforms to optimize your management fees and tax efficiency.

Compare Platforms Now

Fair Linen operates as a completely independent reference resource and research project focused on financial data analysis. This website and its contents are not affiliated with, endorsed by, or associated with any Canadian government agencies, public financial organizations, commercial investment suppliers, or specific robo-advisory brand owners. All data is provided for informational purposes only and does not constitute professional financial advice.